

Bitcoin Suffers Sharpest Crash in Years: $1 Trillion Wiped Out
.jpg)
The past week was brutal for the cryptocurrency market, as a Bitcoin-led selloff set the total market cap back by over $1 trillion in value.
Bitcoin’s drop was the deepest in several years, swiftly turning sentiment decidedly bearish. While the consensus is that a new bear market may have started, the correction had pushed technical indicators near bear market bottom levels.
Is this a bottom in Bitcoin and altcoins, a new bear market, or is something else entirely beginning?
Bitcoin Drops $45,000 in Less Than Two Months: Is The Bull Run Over?
Two months ago, Bitcoin made a push above $126,000. The multi-year bull run was mature, but appeared to have enough momentum to keep rallying higher. However, a lack of strength led to weeks of low volatility consolidation instead. The historically low volatility phase gave way to a powerful move as anticipated, but the market chose down as the ultimate direction.
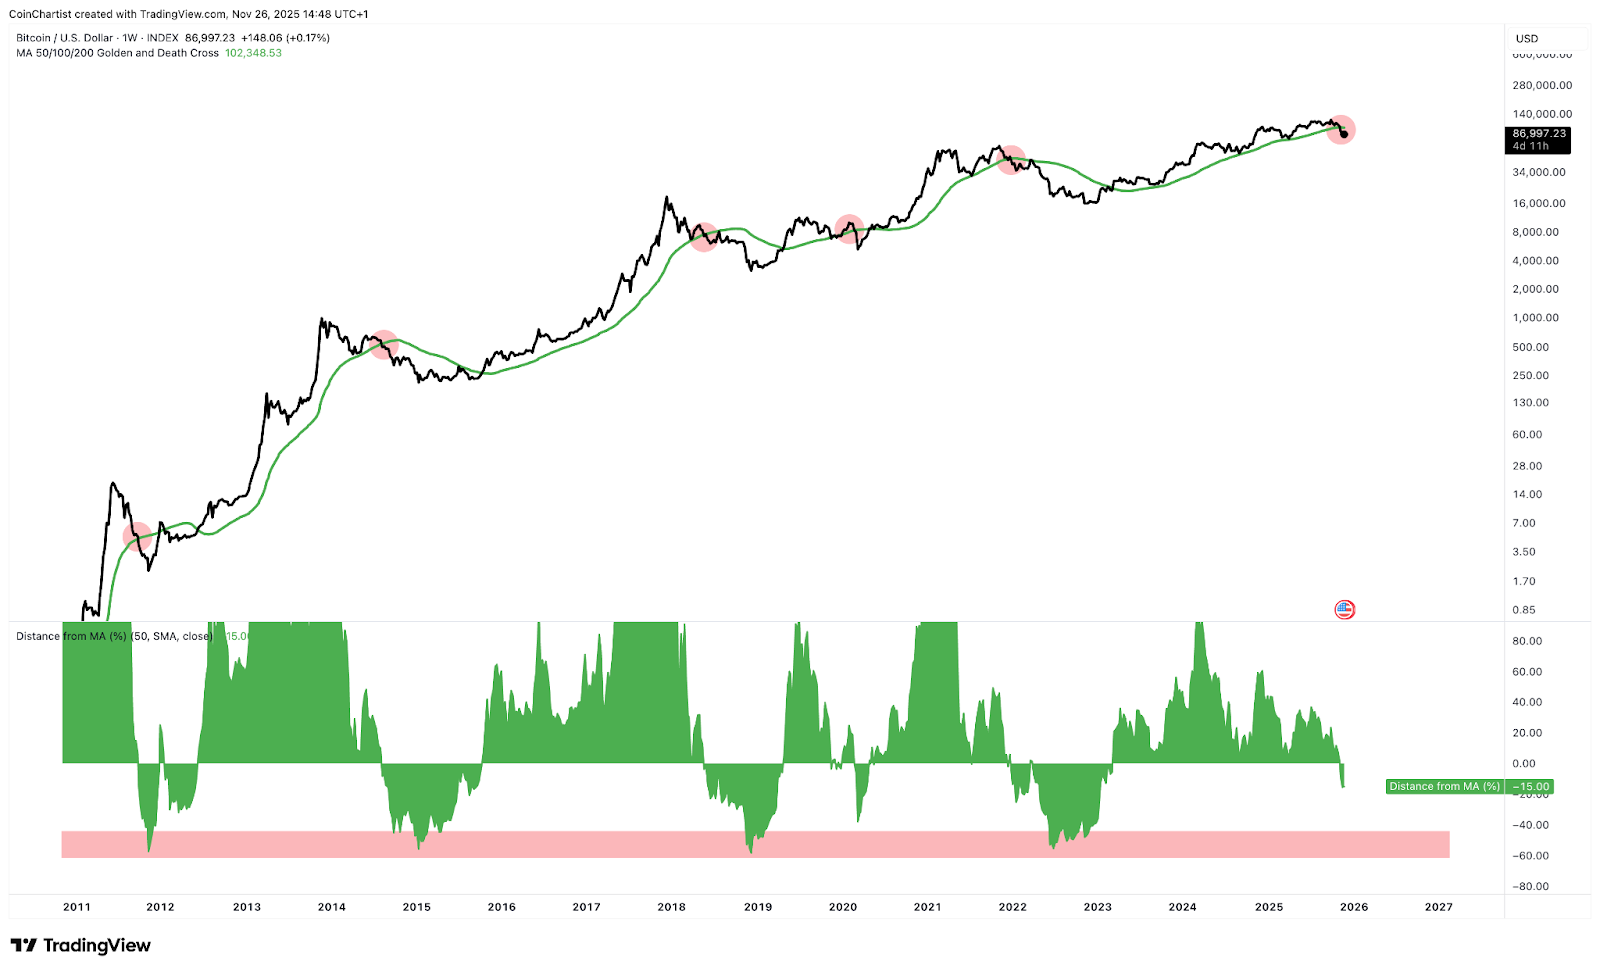
Bitcoin closed below the 50-week MA, but typically has a lot more to fall
The collapse has since broken below key trend lines and the 50-week Moving Average – often considered the line in the sand between bear and bull markets. Bitcoin would need to trade below $74,000 and make a lower low for a true break in market structure.
Bitcoin is Ready to Bounce: Indicators Reach Bear Market Bottom Levels
After such a swift move to the downside, people are fearful or in outright panic. These conditions are often ingredients necessary for the market to put in a bottom. Coincidentally, several technical indicators are at or approaching bear historic bear market levels.
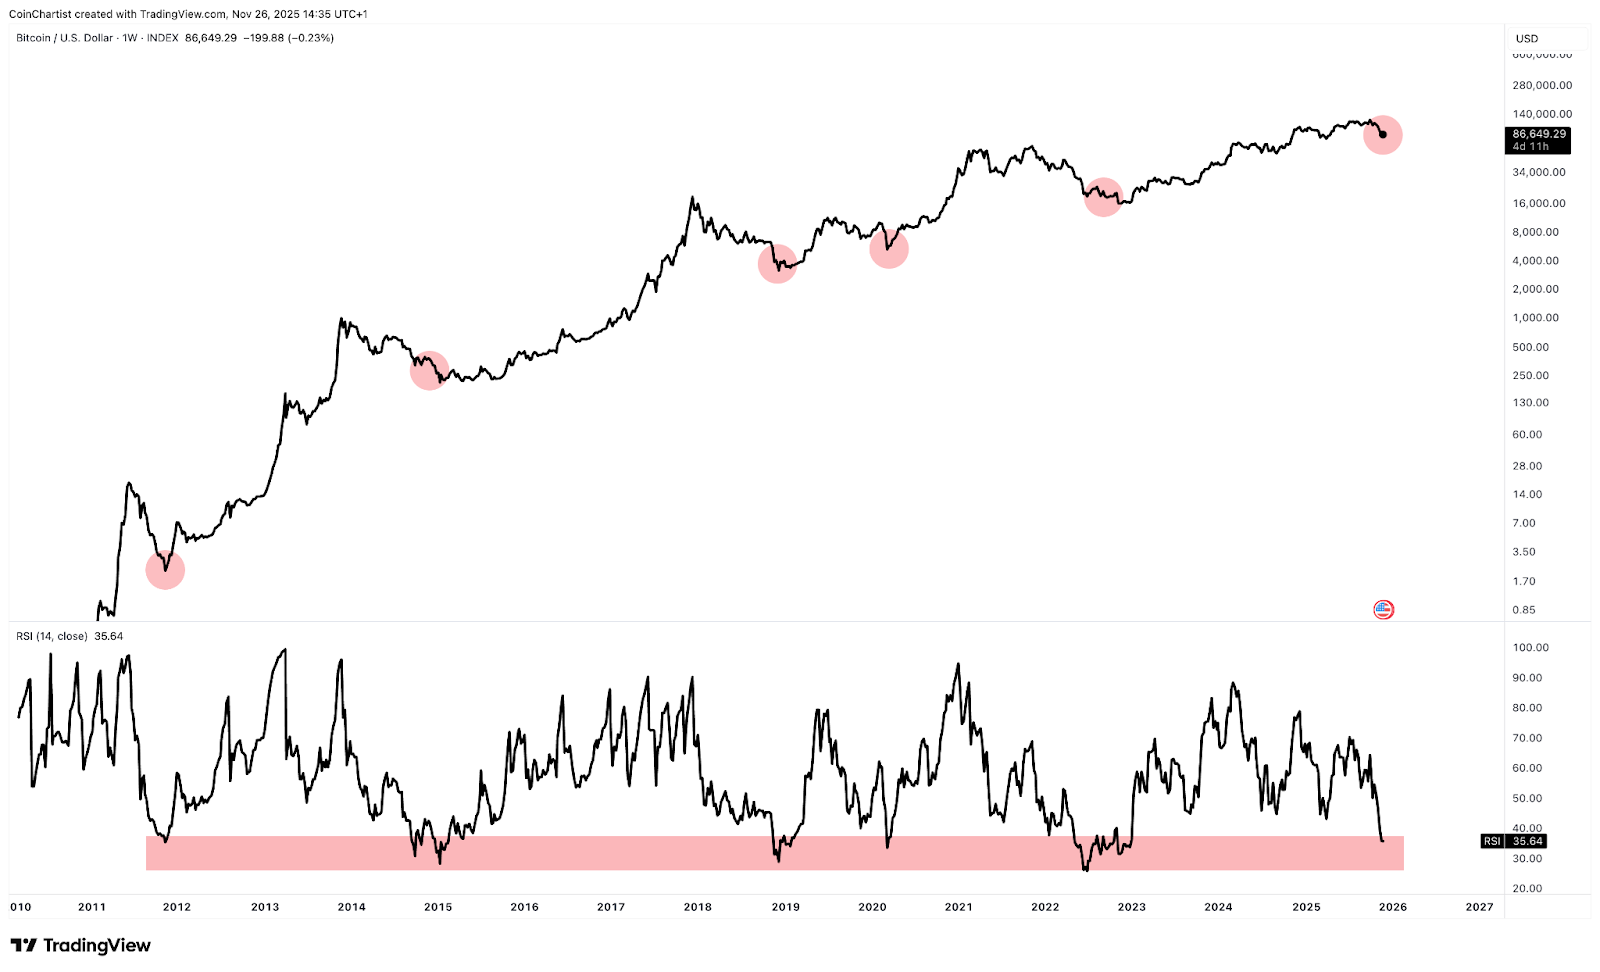
Bitcoin’s weekly Relative Strength Index is at bear market bottom levels
For example, the weekly RSI has reached levels associated with major cyclical bottoms. This recent selloff even reached similar oversold levels as the COVID crash back in 2020. Crypto bounced into another bull run in the following weeks and months. But beware, although the RSI is at bear market bottom levels on the weekly timeframe, the monthly timeframe RSI and higher still have a lot of room left to reach such a similar zone.
ETF Outflows Set New Record as Price Plummets
The institutional bid and ETF narrative has kept Bitcoin climbing in a stair-stepping manner all bull market long. But in November, the bid turned to ask instead, leading to the largest record month of ETF outflows since its inception.
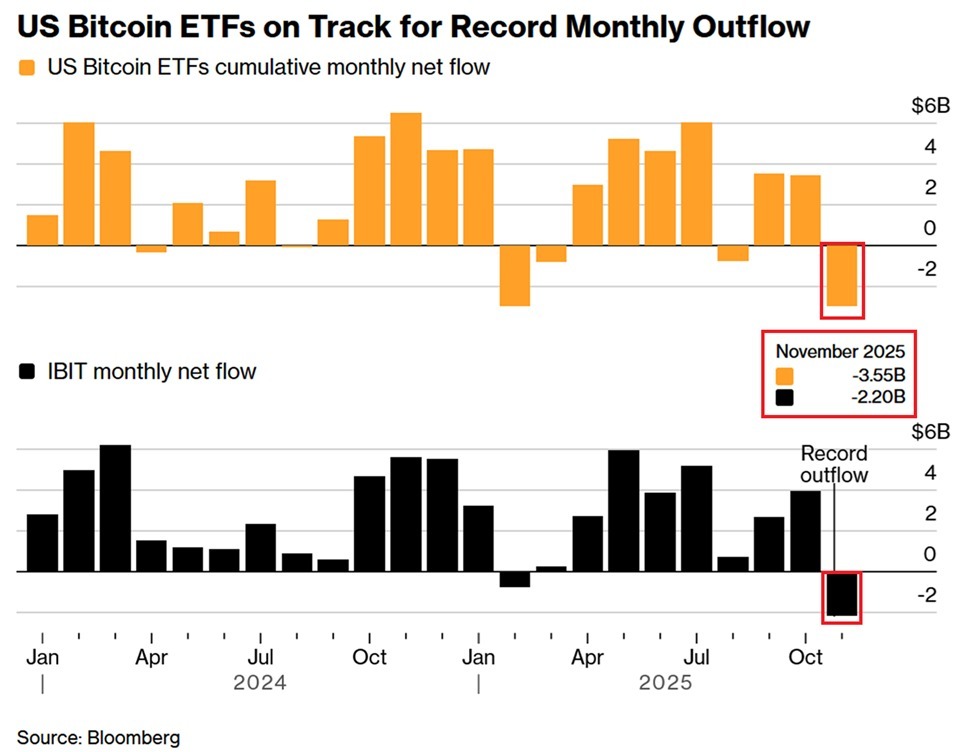
BTC Spot ETF outflows reach record levels in November
ETF Bitcoin outflows hit $3.55 billion in November, putting it on track for the largest monthly outflow ever. It is worth noting, however, that the ETF has only been live since Jan 2024, so it isn’t unusual at this time for data to break previously set records. Still, ETF outflows are putting additional selling pressure on BTC and adding to the overall negative sentiment across the cryptocurrency space.
$1 Trillion in Crypto Market Capital Lost in November
ETF outflow data hints that the downside in crypto was largely driven by Bitcoin sell pressure, surrounding negative sentiment brought down altcoins as well. A combined $1 trillion in market cap was erased from the total cryptocurrency market cap since the start of November.
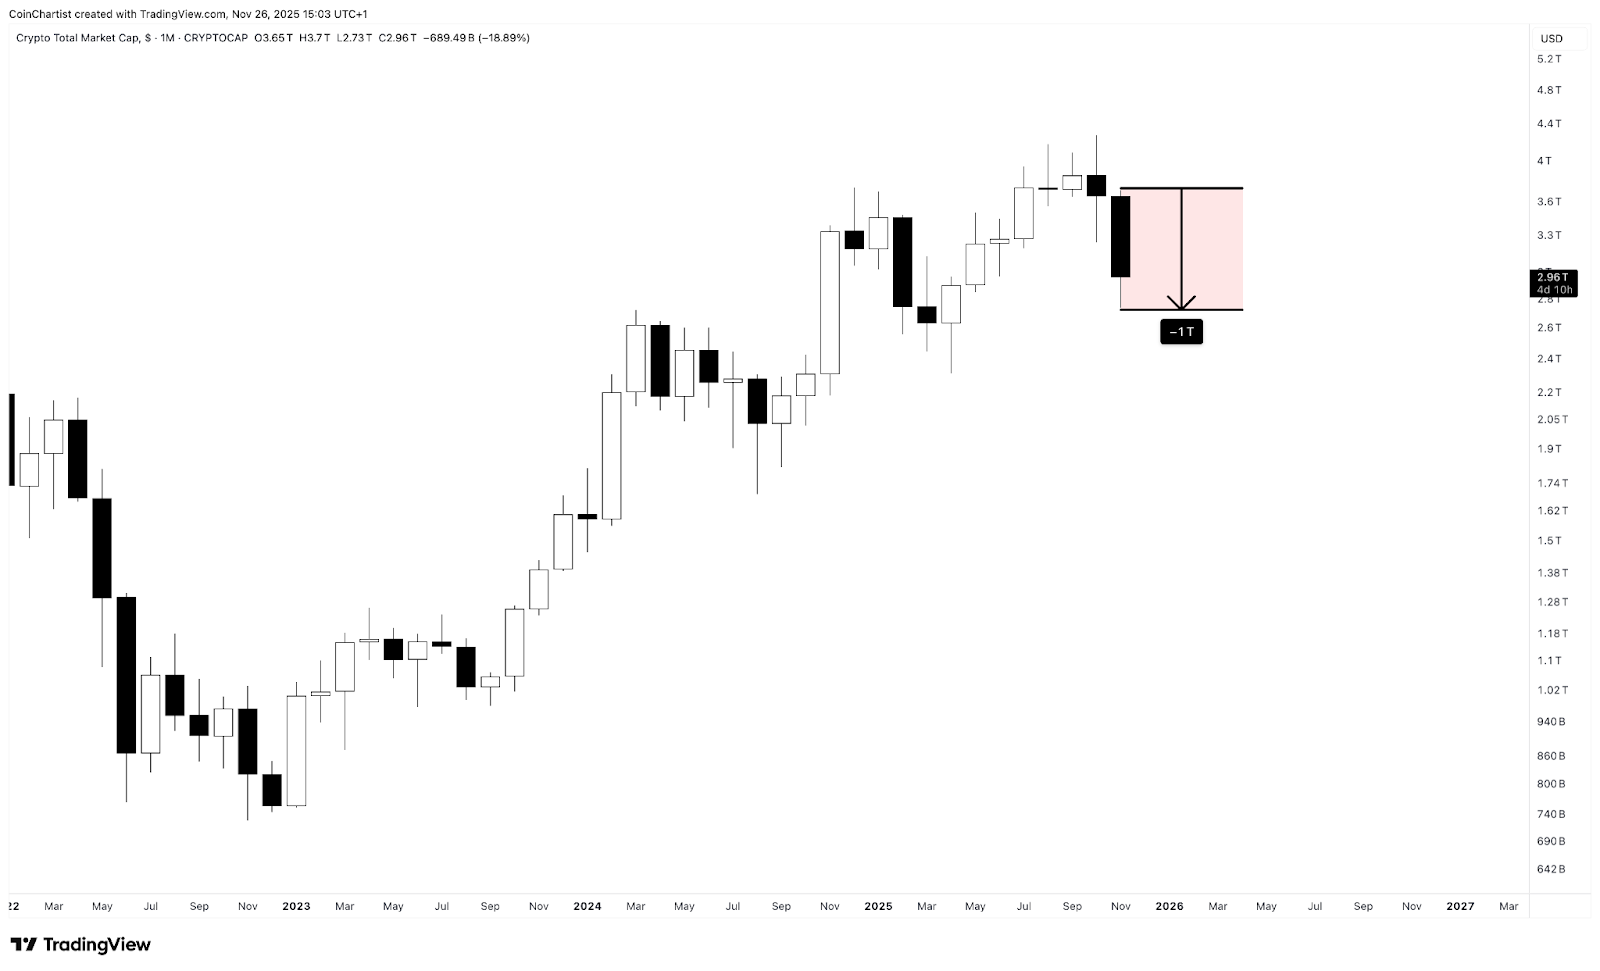
TOTAL, the cryptocurrency market cap index, lost $1 trillion this month
November 2025 is currently the largest dollar for dollar selloff in the history of crypto. February’s dramatic drop was about $80 to $90 billion short of November by comparison. Bitcoin Dominance dropped alongside this move, further suggesting that altcoins have held up better than Bitcoin during this bloodbath.
What Macro Developments Could Decide What Happens Next?
Whether Bitcoin stabilizes or extends its crash may depend less on crypto flows and more on wider macro currents. The market is entering a highly sensitive phase where interest-rate expectations, liquidity trends, and risk sentiment will dictate direction.
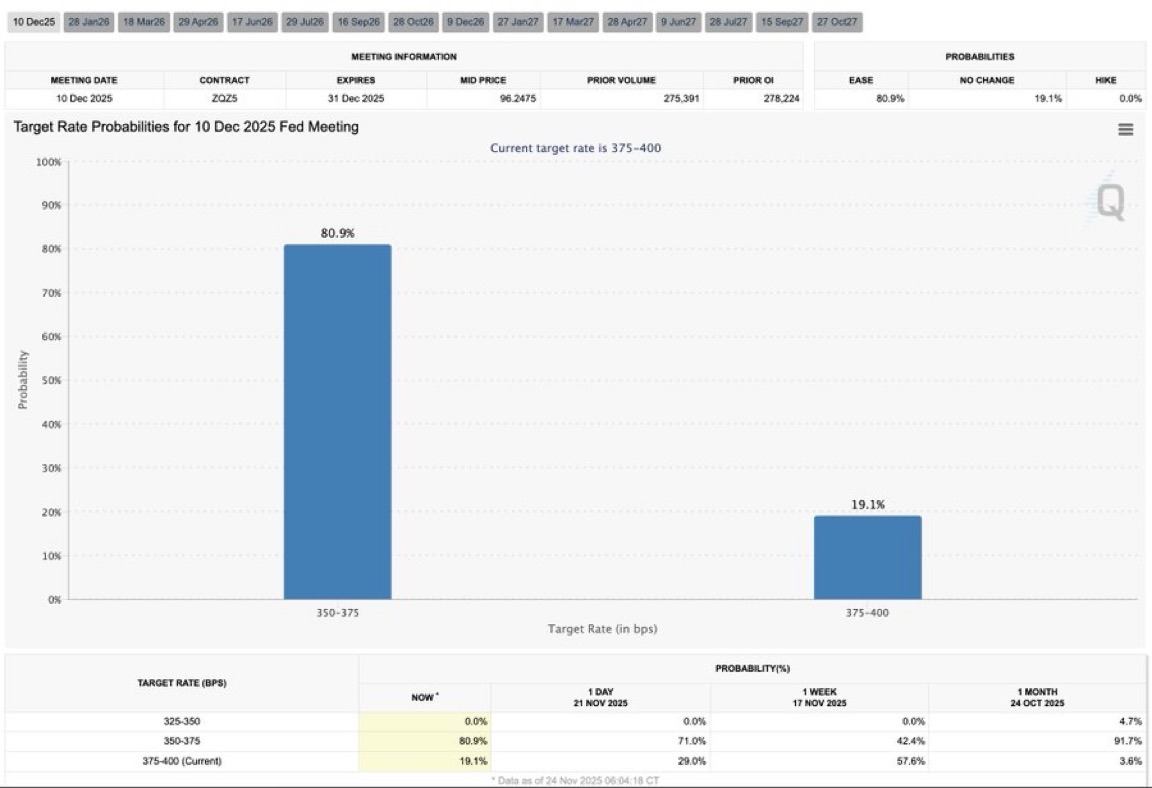
The market sees an 80% probability of a rate cut at the December FOMC
All eyes are on the Federal Reserve as traders debate the timing and size of future rate cuts. A more dovish shift could relieve pressure across all risk assets, providing the liquidity backdrop needed for Bitcoin to reclaim lost support levels. Conversely, stickier-than-expected inflation or hawkish messaging could deepen the risk-off environment and push BTC toward a full market-structure breakdown.
Conclusion
Bitcoin’s sharp and sudden collapse has rattled the crypto market like few events in recent memory, erasing over a trillion dollars in value and breaking through long-standing technical support. With sentiment in freefall and ETF outflows compounding the sell pressure, the market now sits at a critical crossroads.
Some indicators suggest conditions consistent with major cyclical bottoms, while higher-timeframe metrics leave room for deeper downside. Meanwhile, macro forces — from interest-rate expectations to shifts in global liquidity — will play a decisive role in shaping what comes next.
Whether this moment ultimately marks the birth of a new bear market or the final flush before a recovery, one thing is clear: Bitcoin has entered a pivotal phase. Traders should prepare for elevated volatility and remain focused on the macro catalysts that will determine the next major trend.

Suggested Posts


YouHodler is regulated in Switzerland, the EU and Argentina.
YouHodler SA
Registered financial intermediary
YouHodler Italy S.R.L.
Registered as a VASP with the OAM
YouHodler SA
Registered as VASP with Banco de España
YouHodler SA Branch in Argentina.
Registered as a VASP with the CNV.